


Region in detail
Region in detail allows you to browse genes, variants, sequence conservation, and other annotation along the genome. There are three main images (or panels): Chromosome, Overview and Region (Figure 1).
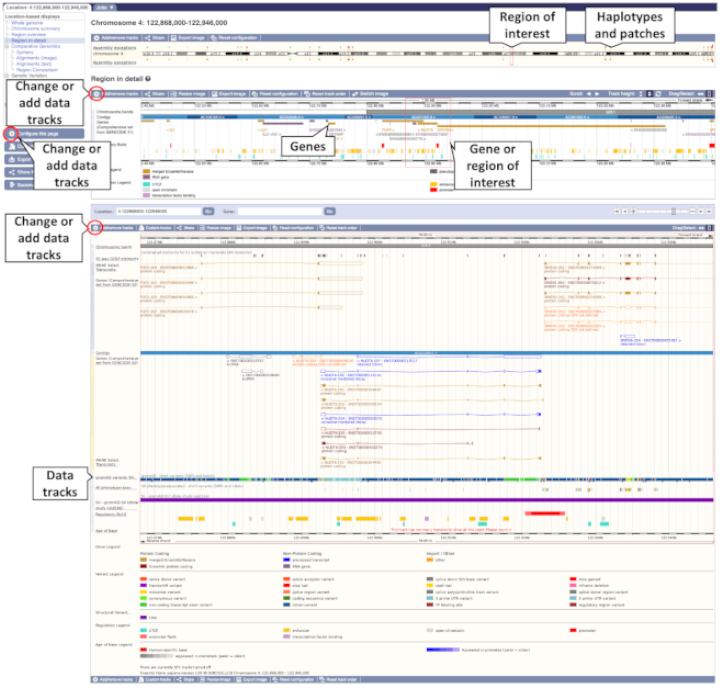
CHROMOSOME IMAGE
The first panel shows the chromosome of interest, marking any haplotypes or patches in red or green, respectively, and a cytogenetic banding pattern when available.
OVERVIEW IMAGE

The next panel is called the Overview Image (Figure 2). It shows an overview of genes along the chromosome (depicted as a blue bar). The overview size depends on the species. It's a 1Mb region in human, 0.5 Mb region in zebrafish and 0.1 Mb in yeast, for example. The individual contigs that make up the genomic assembly are coloured in light or dark blue.
Gene colours are as follows:
- Gold and red genes: protein coding
- Grey, blue and purple genes: non-coding
The overview image is scrollable in up to date versions of Chrome, Firefox, and Internet Explorer 9 and later. There is also support for Safari 5.1, but may not work on certain old Macbooks.
To scroll along the genome, click the scroll arrows (A). Hold the arrows to keep scrolling to farther up or downstream regions.
Use the track height button (B) to switch between fixed track height (arrows facing in icon) and auto-adjust track height (arrows facing out icon), and reset to default using the arrow wheel button. In the fixed track height mode, adjust the height by dragging up and down from the paired horizontal lines between the tracks. As you scroll across the chromosome in automatic track height, the track height automatically adjusts to fit in all features. In fixed track height, you may find that not all features within a track are displayed, and the height needs to be adjusted to fit them in.
Jump to a position in your display using the drag/select icons (C and D). Click the double ended arrow (C) to scroll to another region by dragging the mouse cursor along the image up or downstream. Click (D) to select a region. The cursor will change to a vertical dotted line. Drag a box in the image and select Jump to region or Mark region.
In the overview image display, icons are available to change data tracks, share or resize the view, export the image, reset the configuration, reset data track order and change the image from scroll to static.
REGION IMAGE
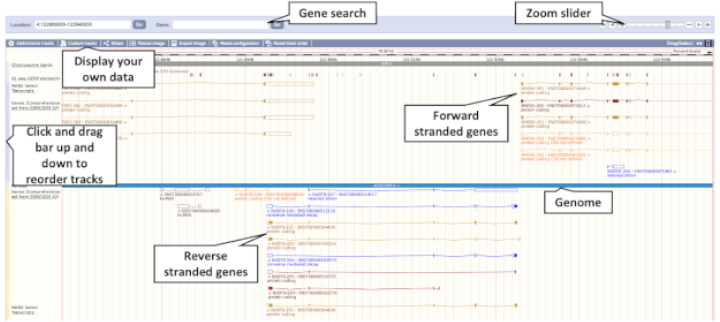
The third image (Figure 3) allows a more zoomed-in view of Ensembl genes and annotation.
Data tracks (genes, cDNA alignments, etc) are shown above and below the blue bar. Tracks above the blue bar are on the forward strand of the chromosome, and tracks under the blue bar are on the reverse strand. Non-stranded data (such as variants or regulatory features) are shown at the very top or bottom of the image.
Reorder the tracks by using the vertical blue/peach bar at the left. To zoom in or change the display, use our zoom slider, or enter in basepairs manually. Alternatively, click any gene or transcript and select the location link in the pop-up window to zoom in on the feature.
The Drag/Select option in the top right of the image allows you to choose your action, scroll to a region or select a region. Select Scroll to move along the genome with a click and drag, and let go to allow the page to reload with your new location. Click Select to drag out a box around a region or feature of interest to view a pop-up window. You can then Mark a region in the view or Jump to a region.
The Region Image supports custom data with the user tracks, which you can display using the Custom Tracks button in the left hand menu or clicking on icon (E), note that this is also where you can view/edit existing data that you've already added your data to Ensembl
MARKING A REGION
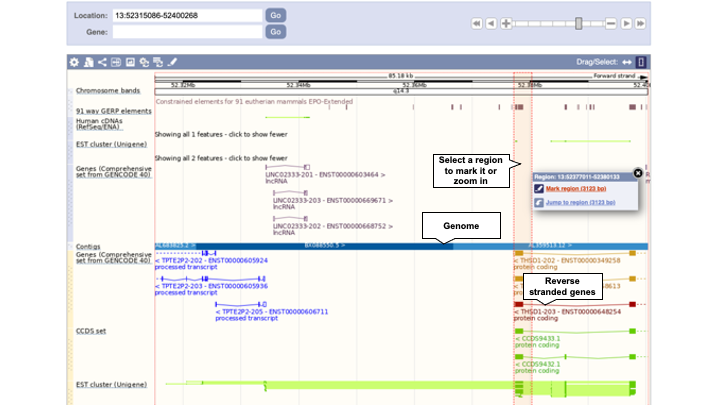

Drag and select a region in this image and use the pop-up window to mark it. You can also click on the gene itself to mark the location of it. The region/gene will be highlighted in grey. The marked region will remain highlighted if you zoom in and out. To remove the marking, click on the (x) (Figure 4).
CONFIGURATION PANEL
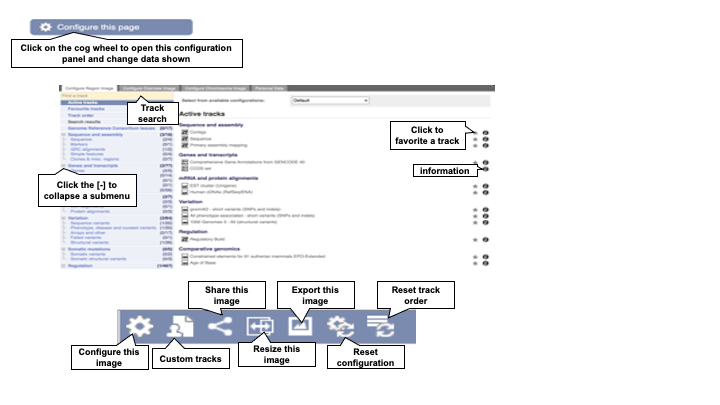
Add or change data tracks using the configure this page tool button at the left of the page, the cog wheel icons in the images, or click on the track name itself. A list of tracks can be viewed in the configuration panel (Figure 5).
If you have added custom tracks or attached public track hubs; you can view, edit or add more in the Personal Data tab of the configuration panel.
Some tracks can be displayed in different styles, however there is a limit on how much data can be displayed in certain styles. This FAQ explains the styles available and the amount of data that can be displayed.
The region in Detail View
