Secondary Structure
The Display
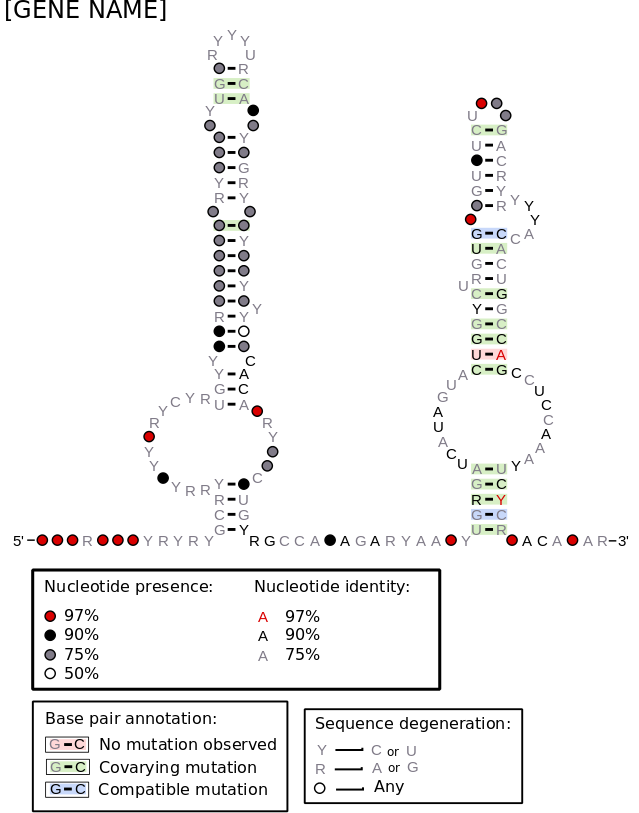
This view shows the secondary structure of a selected ncRNA gene. Base pairing, stem loops and non-paired bases are shown in 2D plots. Depending on the gene, one or two identical structures may be displayed. One is available for every gene, and shows the actual sequence of the ncRNA gene without any annotations. The other structure shows the consensus and sequence conservation of the gene-family to which this ncRNA belongs, and is only available for the genes that are included in the Comparative Genomics pipeline.
The consensus view is coloured and highlighted to indicate the following:
- Nucleotide presence - How often a nucleotide is found in a particular position throughout the gene family
- Nucleotide identity - The frequency of a particular nucleotide (A, T, G or C) in a particular position across family members.
- Base pair annotation - If a mutation is observed in a specific base pairing within a family, and what type of mutation (covarying: base pair differs at both positions or compatible: base pair differs at only one position).
- Sequence degeneration - A one letter code indicates sequence degeneration at a particular position in the family, and indicates the type.
Consensus View:

Structure
The structural information comes primarily from the covariance models provided by RFAM[1] and used for each ncRNA gene family in Ensembl. These covariance models are used for aligning all the Ensembl genes that belong to the same gene family[2] using the Infernal software[3] and a new covariance model is created with the actual sequences of the alignment. The secondary structure is then annotated using the conservation found in the alignment. See the documentation of the ncRNA trees[2] for more information about how the gene-family is constructed and aligned.
If the genes could not be found in the RFAM database, we use RNAFold[7] to predict their structure.
The 2D plots are generated using the r2r[4, 5] package. For more information on r2r, see also below.
Nucleotide conservation
These plots show sequence conservation and base pair covariation. To establish the extent of conservation, the sequences were weighted following the GSC algorithm[6] implemented in Infernal and used by r2r. Weighted nucleotide frequencies were calculated at each position in the multiple alignment. To classify base pairs as covarying the weighted frequency of Watson-Crick or G-U pairs was calculated. Covariation was called if two sequences had pairs that differ at both positions. If only one position differed the occurrence was classified as a compatible mutation. See [6] for more information on this process.
Authors' note on r2r
AUTHORS' WARNING: R2R is not intended to evaluate evidence for covariation or RNA structure where this is in question. It is not appropriate to use R2R's covariation markings to declare that there is evidence of structural conservation within an alignment. R2R is a drawing program. As the original paper, Weinberg and Breaker, 2011, wrote: "This automated R2R annotation[of covariation]does not reflect the extent or confidence of covariation. While such information can be useful, we believe that thorough evaluation of covariation evidence ultimately requires analysis of the full sequence alignment. For example, misleading covariation can result from an incorrect alignment of sequences, or from alignments of sequences that do not function as structured RNAs. Unfortunately, there is no accepted method to assign confidence that entirely eliminates the need to analyze the full alignment."
[2] http://www.ensembl.org/info/genome/compara/ncRNA_methods.html
[3] http://infernal.janelia.org/
[4] http://breaker.research.yale.edu/R2R/
[5] Z. Weinberg and R.R. Breaker. R2R—software to speed the depiction of aesthetic consensus RNA secondary structures. BMC Bioinformatics, 21:3, 2011.
[6] M. Gerstein, E. L. L. Sonnhammer, and C. Chothia. Volume changes in protein evolution. Journal of Molecular Biology, 236(4):1067–78, 1994.


